
해당 포스트는 Instagram Engineering 블로그의 Dismissing Python Garbage Collection at Instagram 포스트를 번역한 글입니다.
게시일: 2017.01.18
인스타그램에서 파이썬 GC 비활성화
인스타그램은 사용하지 않는 데이터를 메모리 공간에서 다시 회수하는 기능인 파이썬 가비지 컬렉션(GC)을 걷어내고서 약 10%의 효율성 향상을 끌어냈습니다. 간단히 말해서 GC를 비활성화함으로써 메모리 사용량을 줄이고 CPU LLC 캐시 적중률을 증가시킬 수 있었습니다. 관련된 자세한 내용은 아래에서 설명드리겠습니다.
인스타그램의 서버 운영 방식
인스타그램 서버는 Django 기반의 멀티 프로세스 모드로 실행되고 있는데, 메인 프로세스 하나가 사용자의 요청을 받는 수십 개의 자식 프로세스를 관리하고 있습니다. 그리고 메인 프로세스와 하위 프로세스 간의 메모리 공유를 위해 WAS 서버로 uWSGI를 pre-fork 모드로 사용하고 있습니다.
Django 서버의 OOM 을 방지하기 위해서 uWSGI 마스터 프로세스는 하위 워커 프로세스의 RSS 메모리 사용량이 일정 수치를 넘어서면 워커 프로세스를 재시작하게 되어있습니다.
메모리에 대한 이해
우리가 주목했던 부분은 메인 프로세스가 새롭게 워커 프로세스를 시작했을 때 해당 워커 프로세스의 RSS 메모리 사용량이 치솟는다는 점이었습니다.
하나의 프로세스를 관찰했을 때 워커 프로세스 생성 시점에 RSS 메모리는 250MB 정도를 잡아먹었지만, 공유 메모리 사용량은 곧바로 250MB에서 140MB로 떨어지는 것을 확인할 수 있었습니다. (공유 메모리 크기는 /proc/PID/smaps에서 확인할 수 있습니다.)
사실 메모리 사용량은 시시각각 변하긴 하지만 전체 메모리의 3분의 1 가량이나 줄어드는 건 흔히 볼 수 있는 현상은 아닙니다.
이제 우리는 왜 공유 메모리가 프로세스 생성 초기에 고유 메모리로 전환되는지 확인해 보기로 했습니다
우리가 세운 가설: Copy-on-Read
리눅스 커널은 포크하고 있는 프로세스들을 최적화하기 위해 Copy-on-Write(COW)라는 메커니즘을 가지고 있습니다. 자식 프로세스는 시작될 때부터 모든 메모리 페이지를 메인 프로세스와 공유하는데, 하나의 페이지는 해당 페이지에 쓰기 작업이 발생했을 때만 자식 프로세스에 복사됩니다. (더 자세한 내용은 https://en.wikipedia.org/wiki/Copy-on-write를 참고해 주세요.)
이런 메커니즘이 파이썬 세계관에서는 레퍼런스 카운팅이라는 작업과 맞물려 재미있는 현상이 발생합니다. 파이썬 인터프리터는 객체를 참조할 때마다 객체 구조체의 refcount 값을 증가시키는데 이 과정에서 쓰기 작업이 발생하고, 결국 COW를 유발하게 됩니다. 어떻게 보면 파이썬에서는 마치 Copy-on-Read(COR)처럼 보여집니다.
#define PyObject_HEAD                   \
    _PyObject_HEAD_EXTRA                \
    Py_ssize_t ob_refcnt;               \
    struct _typeobject *ob_type;
...
typedef struct _object {
    PyObject_HEAD
} PyObject;
우리는 코드 객체(code object)와 같은 파이썬 불변(immutable) 객체의 경우에도 COW 메커니즘이 작동하고 있는지 의문이 들었습니다.
PyCodeObject가 PyObject를 상속받아 작성한 것을 감안하면 분명 동일하게 작동할 겁니다.
그래서 우리의 첫 번째로 시도한 건 바로 PyCodeObject의 레퍼런스 카운팅을 비활성화 하는 것이었습니다.
첫 번째 시도: 코드 객체에서 레퍼런스 카운팅 비활성화
먼저 간단한 작업을 진행했습니다. 시험 삼아 CPython에 작은 변화를 주었는데 코드 객체의 레퍼런스 카운트 수치가 변하지 않도록 작업한 후 해당 인터프리터를 운영 서버 중 하나에 반영해 보았습니다.
하지만 결과는 매우 실망스러웠습니다. 공유 메모리에 아무런 변화도 없었기 때문입니다. 아무리 찾아봐도 우리가 작업한 내용이 효과가 있다는 뚜렷한 지표도 보이지 않았고 공유 메모리와 복사된 코드 객체 사이의 어떠한 연관 관계도 찾을 수 없었습니다. 마치 중요한 무언가를 놓친 것 같아 보였습니다. 여기서 얻은 교훈: 먼저 가설을 점검한 후에 실천에 옮기자.
페이지 폴트 추적
이후 COW에 대해 깊은 조사를 하면서 우리는 COW가 시스템의 페이지 폴트와 연관되어 있다는 사실을 깨달았습니다. 바로 각 COW가 프로세스의 페이지 폴트를 유발한다는 것이었습니다. 리눅스에서 제공하는 Perf 기능을 이용하면 페이지 폴트와 같은 하드웨어/소프트웨어 시스템의 이벤트를 기록할 수 있는데 가능한 경우 스택도 추적할 수 있습니다.
그래서 우리는 운영 서버 인스턴스를 재시작하였고 커널이 포크할 때까지 기다렸습니다. 워커 프로세스가 실행되자 PID를 가져와 아래의 커맨드를 실행하였습니다.
perf record -e page-faults -g -p <PID>
그리고 스택을 추적하면서 언제 페이지 폴트가 발생하는지 감을 잡을 수 있었습니다.
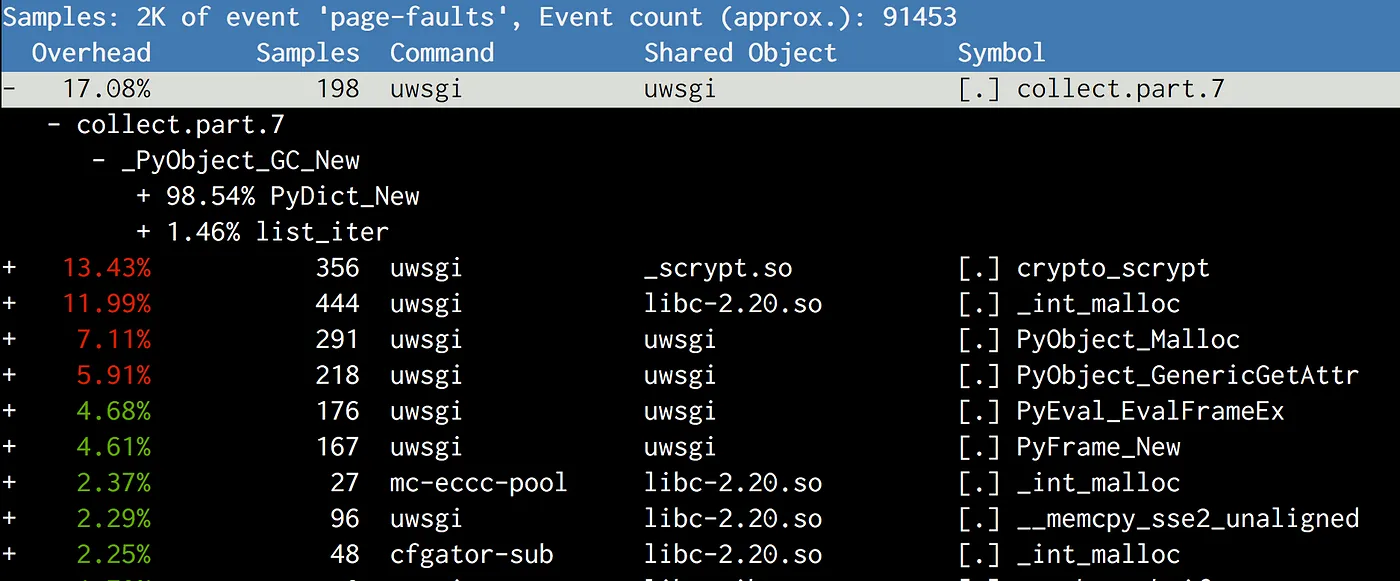
우리는 줄곧 코드 객체의 복사본이 문제를 일으킨다고 생각했지만, 막상 뚜껑을 열어보니 주요 범인은 gcmodule.c 내부의 collect 작업이었습니다.
즉, 가비지 컬렉션이 실행되는 시점에 문제가 발생하는 것이었습니다.
파이썬 GC가 어떻게 동작하는지 면밀히 조사한 후에 우리는 아래와 같은 가설을 세웠습니다.
CPython의 GC는 임계값을 기반으로 실행되는데, 기본 임계값은 매우 낮게 설정되어 있으므로 초창기부터 GC가 발생하게 됩니다. 각 객체는 세대별 분류되어 연결 리스트에서 관리되며 GC 작업 중에는 연결 리스트들은 뒤섞어 객체들이 재배치 됩니다, 이때 연결 리스트는 객체와 한 몸과 같은 관계이기 때문에 이 객체들을 다시 재배치하는 과정에서 페이지가 COW 되는 현상이 발생하게 되는 겁니다.
/* GC information is stored BEFORE the object structure. */
typedef union _gc_head {
    struct {
        union _gc_head *gc_next;
        union _gc_head *gc_prev;
        Py_ssize_t gc_refs;
    } gc;
    long double dummy;  /* force worst-case alignment */
} PyGC_Head;
두 번째 시도: GC를 비활성화
이제 우리를 성가시게 하는 GC를 걷어내 봅시다.
먼저 내부 스크립트에 gc.disable()을 호출하도록 추가했습니다.
다시 서버 인스턴스를 재시작하여 똑같은 과정을 거쳤지만 달라진 건 아무것도 없었습니다.
아마 이때 Perf를 사용했다면 여전히 gc.collect 가 호출되며 메모리에 계속 COW가 발생하는 사실을 알아차렸을 겁니다.
이번에는 GDB로 디버깅을 해보았고 서드 파티 라이브러리 중 하나(msgpack)가 지속적으로 gc.enable()를 호출하고 있어서 gc.disable() 작업이 무용지물이 되었던 사실을 발견했습니다.
해당 msgpack 라이브러리에 손을 대는 순간 다른 라이브러리에도 동일한 현상이 발견된다면 연달아 작업을 해야 하는 상황이 발생할 수도 있기 때문에 이 작업은 제일 후순위로 미뤄두었습니다.
그 이전에 과연 GC를 비활성화하는 게 정말로 효과가 있을지를 증명해야 했는데, 그에 대한 답은 바로 gcmodule.c 안에 있었습니다.
대안으로 gc.disable() 대신 gc.set_threshold(0)를 설정해 보았는데, 그 결과 어떤 라이브러리도 gc.enable()를 호출하지 않았습니다.
이를 통해 각 워커 프로세스의 공유 메모리를 140MB에서 225MB로 크게 끌어올렸고 총 메모리 사용량도 각 인스턴스마다 8GB씩 줄어들었습니다. 이런 방식으로 전체 Django 시스템의 메모리 사용량을 25%나 절약할 수 있었습니다. 이렇게 확보한 자원을 활용하여 실행 중인 프로세스 개수를 늘리거나 RSS 메모리 임계점을 더 높일 수도 있는데, 그 결과 Django 계층의 처리량을 10% 이상 향상시킬 수 있었습니다.
세 번째 시도: GC를 완전히 중단한 후 좌충우돌
여러 설정값을 조정해 보면서 얼마간의 테스트를 거친 후에 좀 더 큰 규모의 클러스터에 적용해 보기로 했습니다. 하지만 배포 도중 문제가 생겼는데 GC가 비활성화 된 채로 웹서버를 다시 구동시키는 시간이 매우 느려졌습니다. 일반적인 재시작이 10초 이내로 마무리되는 반면에 GC가 비활성화된 상태에서는 60초 이상이 걸리기도 했습니다.
2016-05-02_21:46:05.57499 WSGI app 0 (mountpoint='') ready in 115 seconds on interpreter 0x92f480 pid: 4024654 (default app)
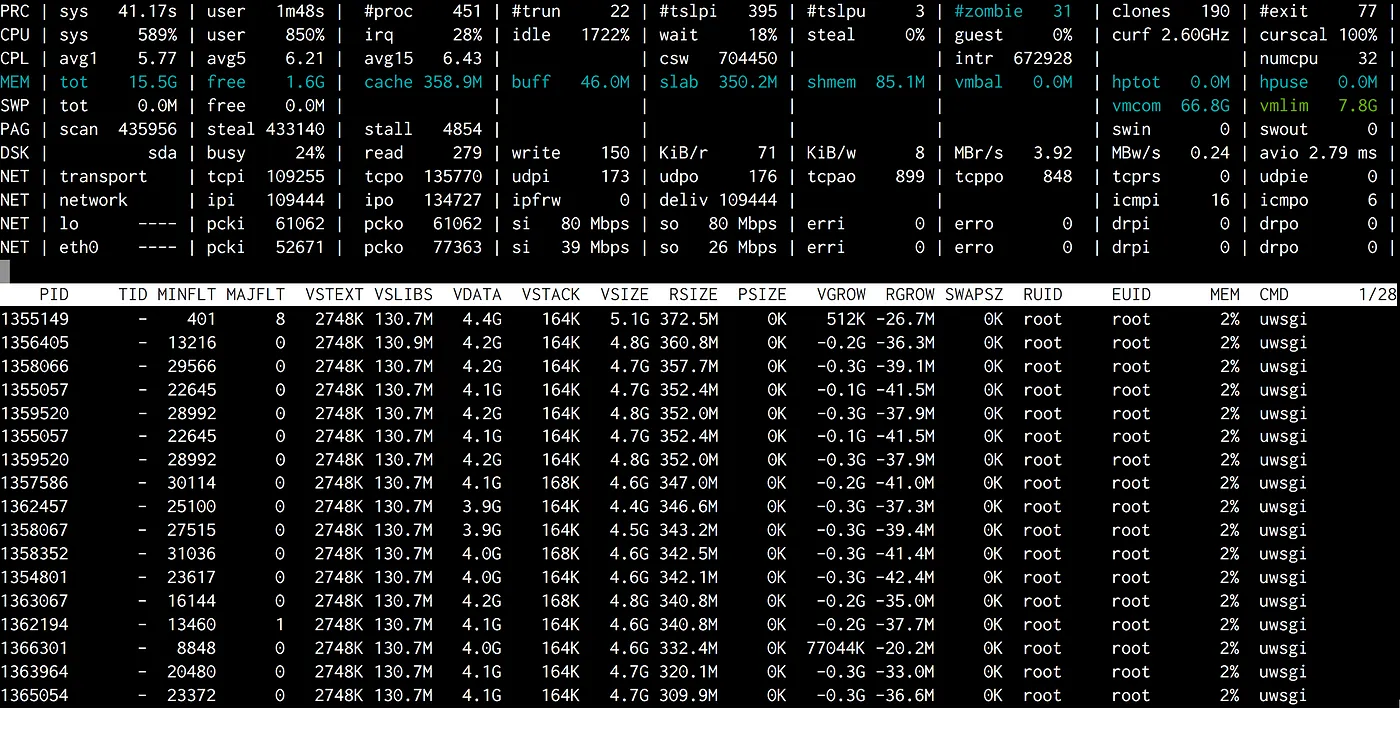
이런 버그는 특정 조건에서만 발행하는 케이스가 아니기 때문에 다시 재현하는 건 쉽지 않았습니다. 그리고 많은 시도 끝에 atop으로 이런 느려짐 현상을 포착할 수 있었습니다. 해당 현상이 발생했을 때 호스트의 사용 가능한 메모리가 거의 0까지 떨어졌고 이미 사용 중인 캐시 메모리까지 잡아먹고 있었습니다. 그래서 소스 코드와 데이터를 전부 디스크에서 직접 가져오면서 속도가 느려지는 현상이 발생했던 겁니다.
아마도 파이썬 인터프리터가 종료되기 직전 GC가 마무리 작업을 진행하는 짧은 순간에 메모리 사용량이 올라간 것으로 보여집니다.
이 추측이 확실한지 확인해 보기 위해서 uWSGI 내부 파이썬 플러그인의 Py_Finalize 호출을 주석 처리하고 나니 해당 문제는 사라졌습니다.
하지만 atexit hook을 이용한 많은 처리 작업들이 Py_Finalize와 맞물려 있었기 때문에 계속 비활성화 한 채로 둘 수는 없었습니다.
결국 우리가 조치한 건 CPython이 아예 GC를 비활성화하도록 런타임 플래그를 추가한 것입니다.
마침내 큰 규모의 클러스터에도 반영해 볼 차례가 되었습니다. 곧바로 인스타그램 전체 시스템에 적용하려고 했지만, 다시 배포 프로세스가 어그러지고 말았습니다. 이번에는 오래된 CPU 모델(Sandybridge)이 있는 서버에서만 문제가 발생했고 에러 상황을 재현하기가 더욱 힘들어졌습니다. 여기서 얻은 교훈: 오래된 클라이언트 및 모델은 고장 나기 쉬우니 항상 테스트해보자.
배포 과정이 워낙 순식간에 이루어지다 보니 에러가 발생하는 순간을 잡아내기가 매우 힘들었고, rollout 커맨드에 별도 atop을 추가하는 방식을 사용했습니다.
그리고 캐시 메모리가 줄어드는 순간을 포착하였는데 모든 uWSGI 프로세스가 MINFLT(마이너 페이지 폴트)를 유발하는 것을 발견했습니다.
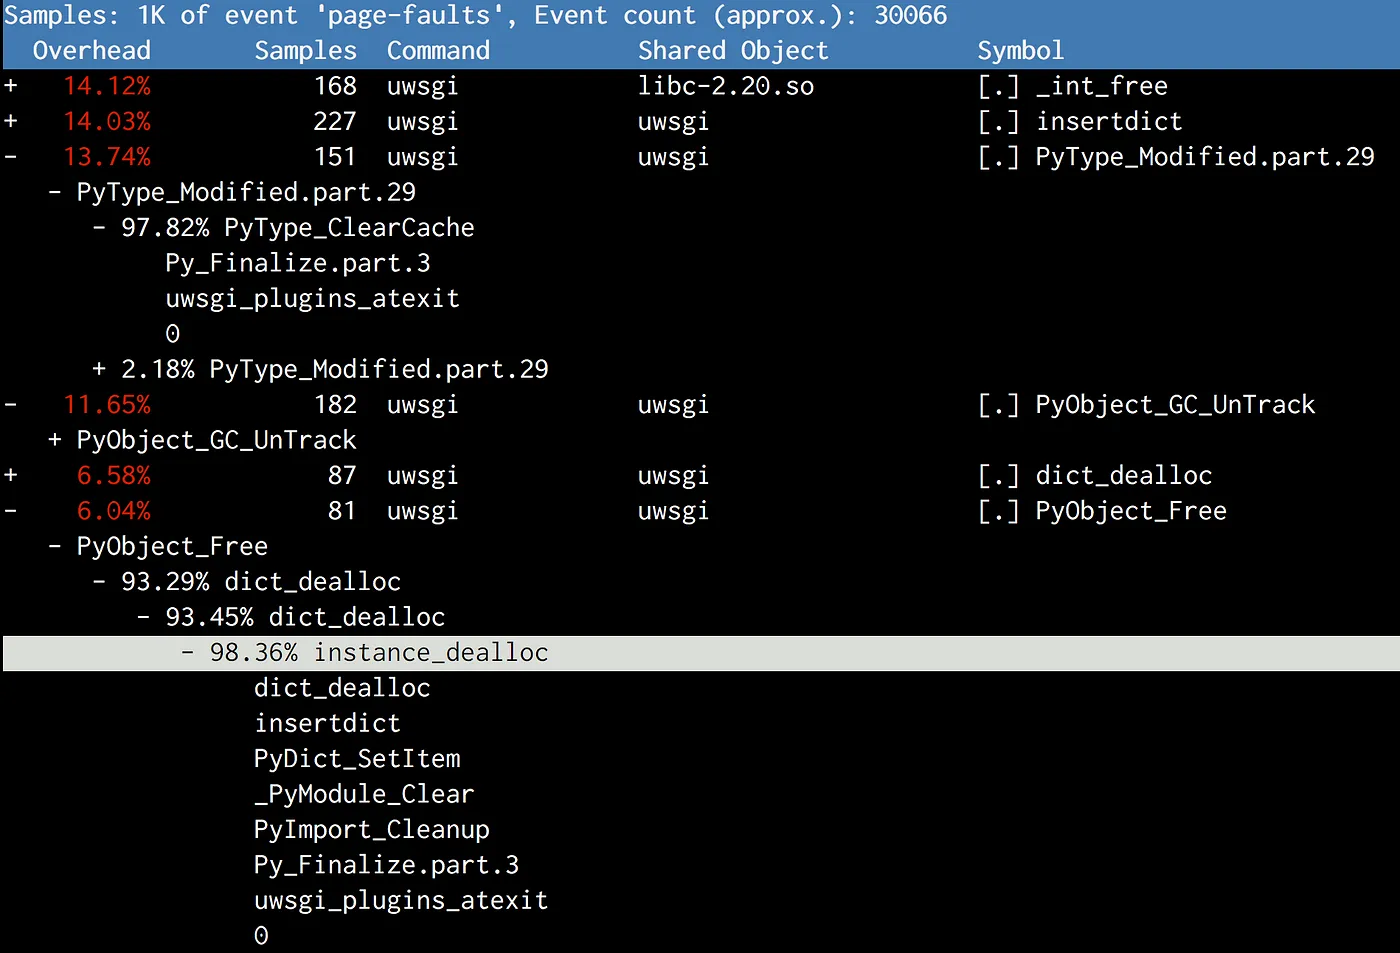
다시 Perf를 사용하여 Py_Finalize를 들여다보았습니다.
파이썬이 종료되는 시점에 GC 마무리 작업 이외에도 타입 객체를 해제하거나 불러왔던 모듈을 정리하는 등의 cleanup 작업을 하게 되는데 이 과정에서 공유 메모리에 부하가 생긴 것으로 보여집니다.
네 번째 시도: Cleanup 없이 GC 비활성화
우리 시스템에서는 하나의 프로세스가 죽어버려도 다른 프로세스로 대체할 수 있기 때문에 꼭 cleanup 작업이 필요하지는 않았습니다. 단지 어플리케이션을 정리해 주는 atexit hook만으로 충분하기 때문에 때문에 파이썬 자체를 cleanup 하는 작업은 없어도 그만이었습니다. 그래서 종료 시점에 아래와 같이 동작하도록 추가했습니다.
# gc.disable() doesn't work, because some random 3rd-party library will
# enable it back implicitly.
gc.set_threshold(0)
# Suicide immediately after other atexit functions finishes.
# CPython will do a bunch of cleanups in Py_Finalize which
# will again cause Copy-on-Write, including a final GC
atexit.register(os._exit, 0)
해당 스크립트는 atexit 함수가 레지스트리의 역순으로 실행된다는 것을 기반으로 작성되었습니다.
atexit 함수는 다른 정리 작업을 마치는 시점에 os._exit(0)를 호출하여 현재 프로세스를 종료하게 됩니다.
단 두 줄을 추가하고 나니 전체 시스템에 배포할 수 있게 되었습니다. 그리고 약간의 메모리 임계값을 조정하고선 약 10%의 자원을 확보하였습니다.
회고
이러한 성과를 곱씹어 보며 우리에게는 아직 두 가지 찜찜한 점이 남아있었습니다.
먼저, 가비지 컬렉션이 없어지면 사용하지 않는 파이썬 메모리를 해제하지 않아서 메모리가 폭발해 버리진 않을지에 대한 걱정입니다. (파이썬의 객체는 모두 스택이 아닌 힙 영역에 할당된다는 사실을 유념해 주세요.)
다행히도 파이썬은 주요 메모리 관리 메커니즘으로 레퍼런스 카운팅 방식을 사용하고 있기 때문에 이러한 상황은 발생하지 않습니다.
Py_DECREF를 호출하여 해당 객체에 대한 참조가 사라질 때마다 파이썬 인터프리터는 해당 객체의 레퍼런스 카운트를 체크하는데, 해당 값이 0이 되는 경우에는 메모리에서 해제하게 됩니다.
가비지 컬렉션의 주요 목적은 레퍼런스 카운팅이 잡아내지 못하는 순환 참조 객체를 검사하는 것입니다.
#define Py_DECREF(op)                                   \
    do {                                                \
        if (_Py_DEC_REFTOTAL  _Py_REF_DEBUG_COMMA       \
        --((PyObject*)(op))->ob_refcnt != 0)            \
            _Py_CHECK_REFCNT(op)                        \
        else                                            \
        _Py_Dealloc((PyObject *)(op));                  \
    } while (0)
이득 파헤쳐 보기
두 번째로 의문이 들었던 점은 과연 이 성능적 이득은 어디에서 왔을까에 대한 것입니다.
GC를 해제함으로써 얻은 이득은 다음 두 가지로 정리할 수 있습니다.
- 메모리 제약이 있는 서버에는 워커 프로세스 개수를 늘리고, CPU 제약이 있는 서버에는 워커 재생성 비율을 낮추어 각 서버마다 약 8GB의 메모리 자원을 확보
- IPC(주기 당 CPU 명령)가 약 10% 증가하여 CPU 처리량 향상
# perf stat -a -e cache-misses,cache-references -- sleep 10
 Performance counter stats for 'system wide':
       268,195,790      cache-misses              #   12.240 % of all cache refs     [100.00%]
     2,191,115,722      cache-references
      10.019172636 seconds time elapsed
GC를 비활성화하면서 캐시 미스율이 2~3% 정도 떨어졌고 곧바로 IPC 개선으로 이어졌습니다. CPU 캐시 미스는 CPU 파이프라인을 정지시키기 때문에 매우 치명적입니다. 그래서 CPU 캐시 적중률이 미미하게 증가하더라도 IPC는 크게 향상될 수 있습니다. 결국 COW가 줄어들면서 각 워커 프로세스에서 더 많은 가상 주소의 CPU 캐시 라인이 동일한 물리 주소를 가리키게 되었고 캐시 적중률이 올라갈 수 있었습니다.
위에서 서술했듯 항상 모든 일이 우리가 원하는대로 흘러가지 않았지만 가끔은 놀라운 결과를 가져오기도 했습니다. 그러니 계속해서 주변을 파헤쳐보고 고민해보세요. 언젠가는 성과를 볼 것입니다.
원문 보기
Dismissing Python Garbage Collection at Instagram
By dismissing the Python garbage collection (GC) mechanism, which reclaims memory by collecting and freeing unused data, Instagram can run 10% more efficiently. Yes, you heard it right! By disabling GC, we can reduce the memory footprint and improve the CPU LLC cache hit ratio. If you’re interested in knowing why, buckle up!
How We Run Our Web Server
Instagram’s web server runs on Django in a multi-process mode with a master process that forks itself to create dozens of worker processes that take incoming user requests. For the application server, we use uWSGI with pre-fork mode to leverage memory sharing between master and worker processes.
In order to prevent the Django server from running into OOM, the uWSGI master process provides a mechanism to restart the worker processes when its RSS memory exceeds the predefined limits.
Understanding Memory
We started by looking into why worker RSS memory grows so fast right after it is spawned by the master process.
One observation is that even though the RSS memory starts with 250MB, its shared memory drops very quickly — from 250MB to about 140MB within a few seconds (shared memory size can be read from /proc/PID/smaps).
The numbers here are uninteresting because they change all the time, but the scale of shared memory dropping is very interesting — about 1/3 of the total memory.
Next we wanted to understand why this shared memory becomes private memory per process at the beginning of the worker spawning.
Our theory: Copy-on-Read
Linux kernel has a mechanism called Copy-on-Write (CoW) that serves as an optimization for forked processes. A child process starts by sharing every memory page with its parent. A page copied to the child’s memory space only when the page is written to (for more details refer to the wiki https://en.wikipedia.org/wiki/Copy-on-write).
But in Python land, because of reference counting, things get interesting. Every time we read a Python object, the interpreter will increase its refcount, which is essentially a write to its underlying data structure. This causes CoW. So with Python, we’re doing Copy-on-Read (CoR)!
#define PyObject_HEAD                   \
    _PyObject_HEAD_EXTRA                \
    Py_ssize_t ob_refcnt;               \
    struct _typeobject *ob_type;
...
typedef struct _object {
    PyObject_HEAD
} PyObject;
So the question is: are we copy-on-writing immutable objects such as the code objects? Given PyCodeObject is indeed a “sub-class” of PyObject, apparently yes.
Our first thought was to disable the reference counting on PyCodeObject.
Attempt 1: Disable reference count on code objects
At Instagram, we do the simple thing first. Given that this was an experiment, we made some small but hacky changes to CPython interpreter, verified the reference count number didn’t change on code object, and then shipped that CPython to one of our production servers.
The result was disappointing because there was no change on shared memory. When we tried to figure out why, we realized we couldn’t find any reliable metrics to prove our hack worked, nor could we prove the connection between the shared memory and the copy of code objects. Apparently, something was missing here. Lesson learned: prove your theory before going for it.
Profiling page faults
After some googling on Copy-on-Write, we learned Copy-on-Write is associated with page faults in the system. Each CoW triggers a page fault in the process. Perf tools that come with Linux allow recording hardware/software system events, including page faults, and can even provide stack trace when possible!
So we went to a prod server, restarted the server, waited for it to fork, got a worker process PID, and then ran the following command.
perf record -e page-faults -g -p <PID>
Then, we got an idea about when page faults happen in the process with stack trace.
The results were different than our expectations.
Rather than copying the code object, the top suspect is collect, which belongs to gcmodule.c, and is called when a garbage collection is triggered. After reading how GC works in CPython, we have the following theory:
CPython’s GC is triggered deterministically based on the threshold.
The default threshold is very low, so it kicks in at a very early stage.
It maintains linked lists of generations of objects, and during GC, the linked lists are shuffled.
Because the linked list structure lives with the object itself (just like ob_refcount), shuffling these objects in the linked lists will cause the pages to be CoWed, which is an unfortunate side effect.
/* GC information is stored BEFORE the object structure. */
typedef union _gc_head {
    struct {
        union _gc_head *gc_next;
        union _gc_head *gc_prev;
        Py_ssize_t gc_refs;
    } gc;
    long double dummy;  /* force worst-case alignment */
} PyGC_Head;
Attempt 2: Let’s try disabling GC
Well, since GC is backstabbing us, let’s disable it!
We added a gc.disable() call to our bootstrapping script.
We restarted the server, but again, no luck!
If we look at perf again, we’ll see gc.collect is still called, and the memory is still copied.
With some debugging with GDB, we found that apparently one of the third-party libraries we used (msgpack) calls gc.enable() to bring it back, so gc.disable() at bootstrapping was washed.
Patching msgpack is the last thing we would do because it leaves the door for other libraries to do the same thing in the future without us noticing.
First, we need to prove disabling GC actually helps.
The answer again lives in gcmodule.c.
As an alternative to gc.disable, we did gc.set_threshold(0), and this time, no libraries brought it back.
With that, we successfully raised the shared memory of each worker process from 140MB to 225MB, and the total memory usage on the host dropped by 8GB per machine. This saved 25% RAM for the whole Django fleet. With such big head room, we’re capable of running a lot more processes or running with a much higher RSS memory threshold. In effect, this improves the throughput of Django tier by more than 10%.
Attempt 3: Completely shutdown GC takes churns
After we experimented with a bunch of settings, we decided to try it on a larger scale: a cluster. The feedback was pretty quick, and our continuous deployment broke because restarting our web server became much slower with GC disabled. Usually restarting takes less than 10 seconds, but with GC disabled, it sometimes took more than 60 seconds.
2016-05-02_21:46:05.57499 WSGI app 0 (mountpoint='') ready in 115 seconds on interpreter 0x92f480 pid: 4024654 (default app)
It was very painful to re-produce this bug because it’s not deterministic. After a lot of experiments, a real re-pro shows in atop. When this happened, the free memory on that host dropped to nearly zero and jumped back, forcing out all of the cached memory. Then came the moment where all the code/data needed to be read from disk (DSK 100%), and everything was slow.
This rung a bell that Python would do a final GC before the interpreter shut down, which would cause a huge jump in memory usage in a very short period of time.
Again, I wanted to prove it first, then figure out how to deal with it properly.
So, I commented out the call to Py_Finalize in uWSGI’s python plugin, and the problem disappeared.
But apparently we couldn’t just disable Py_Finalize as it was.
We had a bunch of important cleanups using atexit hooks that relied on it.
What we ended up doing is adding a runtime flag to CPython that would disable GC completely.
Finally, we got to roll it out to a larger scale. We tried our entire fleet after this, but the continuous deployment broke again. However, this time it only broke on machines with old CPU models (Sandybridge), and was even harder to re-pro. Lesson learned: always test the old clients/models because they’re often the easiest ones to break.
Because our continuous deployment is a fairly fast procedure, to really catch what happened, I added a separate atop to our rollout command.
We’re able to catch a moment where cache memory goes really low, and all of uWSGI processes trigger a lot of MINFLT (minor page faults).
Again, by perf profiling, we saw Py_Finalize again.
Upon shutdown, other than the final GC, Python did a bunch of cleanup operations, like destroying type objects and unloading modules.
Again, this hurt shared memory.
Attempt 4: Final step for shutting down GC: No cleanup
Why do we need to clean up at all? The process is going to die, and we’re going to get another replacement for it. What we really care about is our atexit hooks that do cleanup for our apps. As to Python’s cleanup, we don’t have to do it. This is what we ended up with in our bootstrapping script:
# gc.disable() doesn't work, because some random 3rd-party library will
# enable it back implicitly.
gc.set_threshold(0)
# Suicide immediately after other atexit functions finishes.
# CPython will do a bunch of cleanups in Py_Finalize which
# will again cause Copy-on-Write, including a final GC
atexit.register(os._exit, 0)
This is based on that fact atexit functions run in the reverse order of registry.
The atexit function finishes the other cleanups, then calls os._exit(0) to exit the current process in the last step.
With this two-line change, we finally finished rolling it out to our entire fleet. After carefully adjusting the memory threshold, we got a 10% global capacity win!
Looking back
In reviewing this performance win, we had two questions:
First, without garbage collection, wasn’t the Python memory going to blow up, as all memory allocation wouldn’t be freed ever? (Remember, there is no real stack in Python memory because all objects are allocated on heap.)
Fortunately, this was not true. The primary mechanism in Python to free objects is still reference count.
When an object is de-referenced (calling Py_DECREF), Python runtime always checks if its reference count drops to zero.
In such cases, the deallocator of the objects will be called.
The main purpose of garbage collection is to break the reference cycles where reference count does not work.
#define Py_DECREF(op)                                   \
    do {                                                \
        if (_Py_DEC_REFTOTAL  _Py_REF_DEBUG_COMMA       \
        --((PyObject*)(op))->ob_refcnt != 0)            \
            _Py_CHECK_REFCNT(op)                        \
        else                                            \
        _Py_Dealloc((PyObject *)(op));                  \
    } while (0)
Breaking down the gains
Second question: where did the gain come from?
The gain of disabling GC was two fold:
- We freed up about 8GB RAM for each server we used to create more worker processes for memory-bound server generation, or lower the worker respawn rate for CPU-bound server generation;
- CPU throughput also improved as CPU instructions per cycle (IPC) increased by about 10%.
# perf stat -a -e cache-misses,cache-references -- sleep 10
 Performance counter stats for 'system wide':
       268,195,790      cache-misses              #   12.240 % of all cache refs     [100.00%]
     2,191,115,722      cache-references
      10.019172636 seconds time elapsed
With GC disabled, there was a 2–3% of cache-miss rate drop, which was the main reason behind the 10% IPC improvement. CPU cache miss is expensive because it stalls CPU pipeline. Small improvements on the CPU cache hit rate can usually improve IPC significantly. With less CoW, more CPU cache lines with different virtual addresses (in different worker processes) point to the same physical memory address, leading to better cache hit rate.
As we can see, not every component worked as expected, and sometimes, the results can be very surprising. So keep digging and sniffing around, and you’ll be amazed how things really work!
References